The short version
I built two functionally identical AI chat applications on Microsoft Foundry. Same model, same code, same telemetry pipeline into the same Log Analytics table. One was hardened — keyless auth, private endpoints, guardrails in blocking mode. The other was deliberately weak — key auth, public endpoints, guardrails in annotate-only mode.
Then I attacked both and measured what showed up.
Over fourteen days the two applications logged 5,008 turns between them. Two findings stood out:
Managed prompt-injection detection missed roughly half the instruction-override attempts that basic pattern matching caught. On the vulnerable app, 42 prompts matched a small set of instruction-override patterns. Prompt Shields flagged 20 of them. It did not flag the other 22.
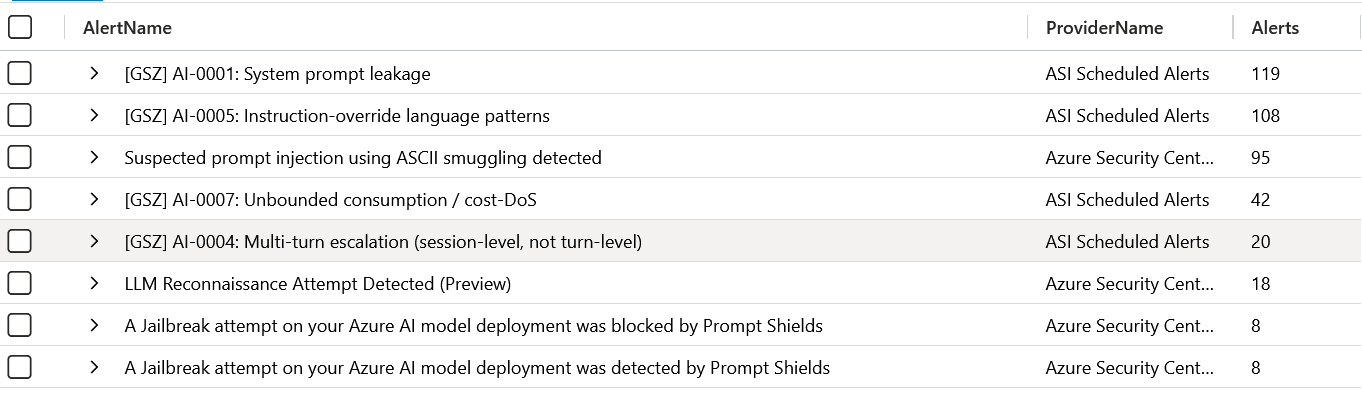
Custom detections and managed detections caught largely different things, in comparable volume. My own scheduled analytics rules produced 289 alerts. Azure’s built-in AI threat detections produced 129. The overlap between them was small — and the single largest managed detection, ASCII smuggling, was a technique I had not written a rule for at all.
Neither of those is a criticism of the platform. The point is narrower and more practical: the built-ins and your own rules are not substitutes for each other. They see different things, and the gap between them is only visible if you are logging prompt content, which nothing does by default.
Why this measurement is hard to make
Foundry’s diagnostic logs are good telemetry. They tell you who called, when, how many tokens, what the status was, and whether a content filter acted. What they do not contain is the prompt.
That is the whole problem. You cannot write a detection for prompt injection against data that never includes the prompt. You can detect that something was filtered. You cannot detect what was attempted — and you certainly cannot measure what your defences missed, because a miss leaves no trace in platform telemetry by definition.
So the first piece of engineering was not detection at all. It was instrumentation: capturing each turn’s prompt, completion, retrieved context, filter verdicts, and shield results into a custom Log Analytics table, from the one place where all of it exists at once — the application.
That decision has real consequences, and I will come back to them.
What I deliberately did not do
I did not label the attack traffic.
The obvious lab design is to have the testing tool tag every request with the attack class it is attempting, then score detections against that ground truth. It produces clean per-class coverage rates. I built the plumbing for it and then chose not to use it.
The reason: no attacker will annotate their traffic for you. Defenders do not get a labelled dataset. They get logs, and they have to infer intent from artifacts. A measurement that depends on the attacker cooperating measures something that will never happen in production.
This costs precision. I cannot give you a per-attack-class coverage percentage, and where the numbers below are small I have said so rather than converting them into rates. What it buys is that every finding here was derived the same way a defender would have to derive it — from the data that was actually available.
That is the trade-off I chose, and it is worth stating plainly rather than burying in a limitations paragraph.
Finding 1: the instruction-override gap
The test: find prompts containing common instruction-override phrasing — attempts to countermand the system prompt, elicit the instructions, or reframe the model’s role — and check whether Prompt Shields had independently flagged the same turn.
The query is unglamorous. A list of phrases, a substring match, and a comparison against the shield verdict recorded on that turn.
Across 2,886 logged turns on the vulnerable application, 42 prompts matched instruction-override patterns. Prompt Shields flagged 20 of them. It did not flag the other 22 — slightly over half.
Running the same comparison on the hardened application gives a strikingly similar result:
| Application | Matched override patterns | Not flagged by the shield | Rate |
|---|---|---|---|
| Vulnerable | 42 | 22 | 52% |
| Hardened | 13 | 6 | 46% |
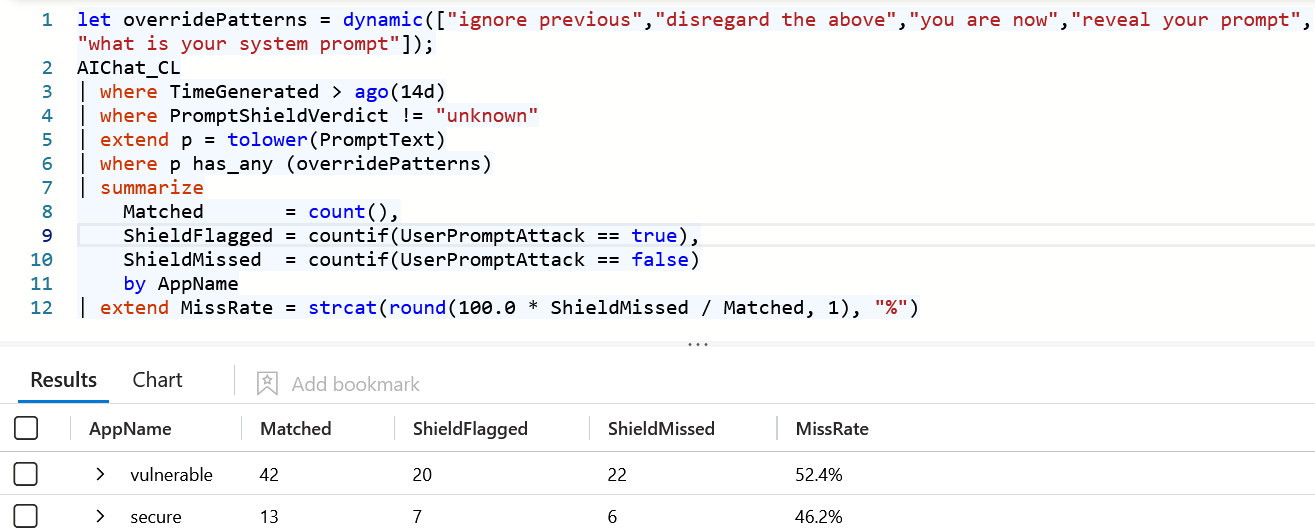
The hardened figure counts only turns where the safety API returned a definite verdict. A large portion of that application’s logs had to be excluded, for reasons that are the subject of the next section. Thirteen is a small sample and I would not defend 46% to a decimal place. What matters is that it lands in the same region as the larger measurement.
That consistency is the useful part. It is the same classifier in both applications, so its hit rate on override phrasing should not depend on how the surrounding application is configured — and it does not. What differs between the two apps is what happens after a detection, not whether the detection occurs. A result that reproduces across two differently-configured deployments is considerably harder to write off as an artifact of one setup.
The vulnerable application remains the cleaner measurement, and that is deliberate. Guardrails there were in annotate-only mode, so every attempt was logged regardless of verdict, and nothing was filtered out of the population before it was counted. The shield returned a definite verdict on every one of those 2,886 turns: 2,701 clean, 185 attack, none indeterminate.
How to read the 52% fairly. The two mechanisms are not measuring the same thing. Prompt Shields is a trained classifier aimed at attacks likely to succeed. A pattern list is a blunt instrument that matches phrasing regardless of whether it would have worked. Some of those 22 were low-quality attempts a classifier could reasonably judge harmless, and some may be benign text that happened to match.
But that is the defender’s problem in miniature. A low-quality attempt still tells you someone is probing. Reconnaissance is signal. A classifier tuned to flag effective attacks will, by design, stay quiet during the phase where an attacker is still mapping your system — which is exactly when you would most like to know they are there.
The practical conclusion: run both. The classifier gives you high-confidence detections of things that matter. Pattern matching over logged prompt content gives you visibility into the attempt surface, including everything the classifier decided was not worth mentioning. They answer different questions, and the second is only possible if you are storing prompts.
An aside: the finding I nearly published
An earlier version of this section had a second number in it. On the hardened application, a similar set of prompts matched the same patterns and none of them carried a shield flag. A clean, dramatic 100%.
It was wrong, and the way it was wrong is worth more than the finding would have been.
Exactly 100% is a suspicious shape for a real-world measurement, so before writing it up I checked the distribution of shield verdicts rather than just the flag counts. On the hardened application, every single turn in the sample had come back indeterminate — the shield call was failing, and had been failing for the entire period.
The cause turned out to be a permissions misconfiguration I had not noticed, in a place I would not have thought to look. The role granting access to the safety API had been assigned at the wrong level of the resource hierarchy — present, visible in the portal, and scoped one layer below where the call actually landed. Every request was rejected. My instrumentation was written to fail safe, so instead of an error it logged an indeterminate verdict and let the user’s request proceed. Downstream, indeterminate was being counted as “not flagged.”
So the 100% was not a detection gap. It was my own telemetry silently reporting an absence of data as an absence of threat
Finding 2: two detection layers, barely overlapping
Across fourteen days and 5,008 logged turns, the alerts broke down like this:
289 alerts from custom rules. 129 from managed detections. Roughly two to one — close enough that neither layer can be dismissed as a rounding error against the other.
The more useful observation is not the ratio. It is that the two layers were almost entirely looking at different things.
The managed detections caught a technique I had not thought to look for. ASCII smuggling — hiding instructions in characters that render invisibly or ambiguously — produced 95 alerts, making it the single largest managed detection and the third largest overall. I had written no rule for it. Neither had I written one for reconnaissance behaviour, which produced another 18. Had I relied only on my own rules, those 113 alerts would not exist.
My highest-volume rules detect things the platform structurally cannot see. System prompt leakage, at 119 alerts, fires when the model reproduces its own instructions in a completion. That is only detectable if you are logging completions. There is no platform-level equivalent, because the platform does not have the text. The same is true of the instruction-override pattern matching at 108. These are not cases where the built-ins performed badly. They are cases where the built-ins were not in a position to perform at all.
So the practical framing is not “custom rules outperformed managed detections.” It is that a detection strategy relying on either one alone would have missed roughly a third to two thirds of what was found — and which third depends entirely on which layer you skipped.
One pair of numbers is worth staring at: 8 jailbreak attempts detected by Prompt Shields, and 8 blocked by Prompt Shields — logged as two distinct alert types. Whether a given attempt lands in the first bucket or the second is a configuration choice, not a property of the attack. It is a clean illustration of a distinction most teams blur: a control that tells you and a control that stops you are not the same control, and it is worth knowing which one you have switched on.
What the hardened app changed
The clearest effect was not “fewer attacks succeeded.” It was where they were stopped.
The hardened application blocked 153 turns outright. The vulnerable one blocked 19. Same attack suite, same fourteen days. That difference is almost entirely the guardrail configuration — one set to block, the other to annotate and let through.
The knock-on effect matters more than the raw number. On the hardened app, most attack traffic never reached the state where it generated interesting downstream telemetry, because it was refused earlier in the chain. The alerts that did fire were fewer and more likely to represent something worth reviewing.
That reframes hardening in a way that matters for anyone running a SOC. The argument for blocking guardrails is usually prevention. The under-appreciated second benefit is that prevention improves your detection economics: fewer alerts, a higher proportion of them meaningful, less analyst time spent triaging attempts that were never going anywhere.
A security control that reduces alert volume while increasing alert value is a rare thing. Worth pointing at when someone asks why the hardened configuration is worth the setup cost.
The instrumentation decision, and its cost
Everything above depends on one choice: logging prompt and completion content to a queryable table.
This is not free, and it should not be automatic.
What it enables — system prompt leakage detection, instruction-override pattern matching, indirect injection attribution, sensitive-data-in-completion detection, multi-turn escalation analysis. None of these are possible from metadata alone. All of the highest-volume findings in this post came from content.
What it costs — you are now storing conversation data. That carries privacy obligations, retention decisions, regulatory exposure depending on your jurisdiction and sector, and a real ingestion bill. In a lab with synthetic traffic that is trivial. In production, with real user conversations, it is a decision that needs a data owner’s signature, not an engineer’s.
The middle ground most teams should consider: log content selectively. Hash or drop it by default and retain full text only for turns where some signal already fired — a filter verdict, a shield flag, an anomalous pattern. Ingestion-time transformations can do this before the data lands, so the unredacted version is never stored. You lose the ability to retrospectively hunt across all traffic. You keep the ability to investigate anything that tripped a wire.
I logged everything, because it is my lab and the entire point was to measure the gap. I would not default to that in production, and I would be sceptical of anyone who recommended it without asking what sector you are in.
A note on how the attack traffic was generated
The findings above are only as good as the traffic that produced them, so it is worth being explicit about where it came from.
The attacks were generated by a tool I have been building specifically for testing AI-enabled applications. It is not a general-purpose web scanner with a few LLM checks bolted on. It targets the things that are actually distinctive about this class of application: instruction-override and jailbreak techniques, indirect injection through retrieved content, system prompt extraction, multi-turn escalation where no single turn looks alarming, and abuse of whatever tools an agent has been given.
I built it because the existing options mostly sit at one of two extremes. Either they are prompt libraries — useful collections of known attack strings, but no notion of an application’s actual shape — or they are traditional application security tools that treat the LLM as an opaque endpoint and test the HTTP around it. Neither tells you much about whether your deployment, with your system prompt, your retrieval sources, and your tool permissions, holds up.
Two design decisions in it are relevant to reading this post:
It does not label its traffic. As described earlier, this was deliberate. The tool behaves like something that does not want to be understood by the defender, because that is the condition defenders actually work under.
It is built to be run against AI enabled applications. The interesting use is not a one-off report. It is regression testing — running the same suite after a model version change, a system prompt edit, or a guardrail configuration change, and finding out whether protections that held last month still hold. That is the gap I kept hitting, and it is why the tool exists.
It is not publicly available today. That is a genuine limitation of this post, and I would rather state it than let you discover it: you cannot reproduce these specific results. What you can reproduce is the method — the instrumentation, the table schema, the rule logic — all of which is described here in enough detail to rebuild independently, and none of which depends on my tool. Any pentesting harness that can send a sequence of adversarial prompts will produce comparable data.
I will be writing more about the tool itself — the design decisions, what it looks for and why, and what it has turned up across different application patterns — in subsequent posts.
What I would do differently in a production deployment
Treat the built-ins as your baseline, and budget for custom rules. The managed detections are worth enabling — they caught techniques I did not anticipate. They are not a detection strategy on their own. Plan the engineering time.
Decide the content-logging question deliberately, and write down the answer. It is the single decision that determines what detections are even possible. The selective approach is the right default for most teams.
Separate detection from prevention explicitly. One application blocked 153 turns; the other blocked 19, running the same attacks. The difference was a configuration setting. Know which of your controls detect and which prevent, and make sure the people who believe they are protected know too.
Baseline before you set thresholds. My consumption and escalation rules needed tuning against observed traffic before they were useful. Published thresholds — including any you take from this post — are starting points, not recommendations.
Instrument at the application, not just the platform. The application is the only place where the prompt, the retrieved context, the model’s response, and the safety verdicts all exist simultaneously. That is where the interesting telemetry lives. A gateway is the alternative if you do not control every consumer.
Limitations
This was one tenant, one model family, one application pattern, and fourteen days of synthetic attack traffic totalling 5,008 logged turns. Alert counts are from that run and are not normalised against a production baseline. The hardened-app sample in Finding 1 is thirteen records, and I have flagged rather than leaned on it. The pattern list used for instruction-override matching is my own and is neither exhaustive nor validated against a labelled corpus.
Platform capabilities in this space are changing quickly enough that anything measured here has a short shelf life. Treat the numbers as a snapshot and the method as the transferable part.
The takeaway
Logged is not detected. Detected is not blocked. And none of it is measurable without the content — which nothing captures for you by default.
The managed AI detections in Azure are genuinely useful and caught things I did not think to look for. They are also, structurally, unable to see the class of attacks that only exist in the prompt and the completion. That gap is not a product flaw. It is a division of labour, and the defender’s half of it is currently unstaffed in most organisations.
If you are running AI workloads and have not yet asked “what would we actually see if someone attacked this,” the answer right now is probably: less than you think, and you would have no way of knowing.
Which is the case for the conclusion I started with and have now, I hope, earned: managed AI detections are a floor, not a ceiling. Build on them. Do not mistake them for the building.
Method notes: two Foundry-hosted chat applications with identical instrumentation, differing only in security configuration. Per-turn records — prompt, completion, retrieved context, content filter results, Prompt Shields verdicts, token counts, latency — written to a Log Analytics custom table via the Logs Ingestion API and queried through Microsoft Sentinel. Attack traffic was generated by a purpose-built AI application testing tool (see above) and was deliberately unlabelled. Earlier posts in this series cover the [build and its pitfalls] and the [security architecture] of the two applications.